SQL Data Steps
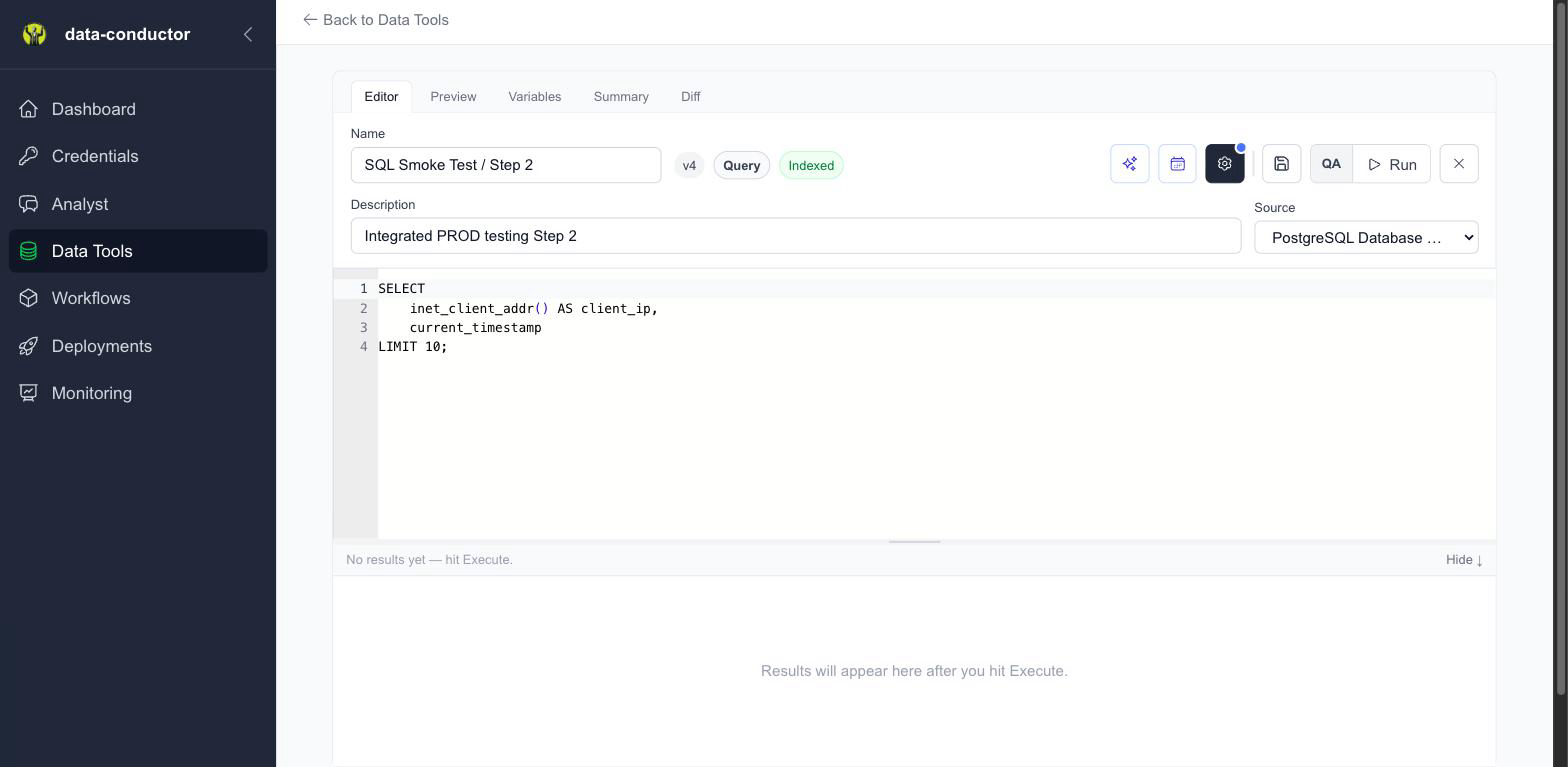
SQL data steps are the building blocks of every pipeline. This is where you write a query, test it against a real connection, parameterise it with variables, and version it.
Overview
Data steps provide:
- SQL Editor with syntax highlighting and auto-completion
- Real-time query execution with immediate results
- Pipeline variables for dynamic SQL queries
- Version management with diff comparison
- Preview mode with variable substitution
- Multiple database integrations
Creating Data Steps
Starting a New Data Step
- Navigate to Data Tools from the sidebar, then open the Data card
- Click + New to create a new data step
- You'll see the SQL editor interface with several tabs:
- Editor: Write and edit your SQL
- Preview: See SQL with variables replaced
- Results: View execution results
- Diff: Compare with other versions (when available)
Basic Information
Fill in the required fields:
- Name: A descriptive name for your data step
- Description: Optional description of what this step does
- Integration: Select which database to connect to
SQL Editor Features
Syntax Highlighting and Auto-completion
The Monaco editor provides:
- SQL syntax highlighting
- Auto-completion for keywords
- Error detection and highlighting
- Multiple cursor support
- Find and replace functionality
Writing SQL Queries
Write your SQL queries in the editor. Here's a simple example:
SELECT
    customer_id,
    customer_name,
    order_date,
    total_amount,
    status
FROM orders
WHERE order_date >= '2024-01-01'
    AND status IN ('completed', 'shipped')
ORDER BY order_date DESC
LIMIT 100
Pipeline Variables
Pipeline variables make your SQL queries dynamic and reusable.
Defining Variables
Variables use mustache syntax: {{VARIABLE_NAME}}
SELECT
    customer_id,
    customer_name,
    order_date,
    total_amount
FROM orders
WHERE order_date >= '{{START_DATE}}'
    AND order_date <= '{{END_DATE}}'
    AND region = '{{REGION}}'
    AND total_amount >= {{MIN_AMOUNT}}
ORDER BY order_date DESC
LIMIT {{LIMIT}}
Variable Configuration
Open the Variables tab. It's an inline grid, not a dialog: one row per
{{placeholder}} in your SQL, one column per environment. QA and PROD
are always present; environments you add appear to their right.
| Variable | QA | PROD |
|---|---|---|
START_DATE |
2024-06-01 |
2024-01-01 |
REGION |
US-West |
ALL |
MIN_AMOUNT |
50 |
0 |
Cells save when you click away. There's no type field and no default value — a variable is simply the text substituted for its placeholder in the environment you run against. Quote it in your SQL exactly as you would a literal:
WHERE region     = '{{REGION}}'      -- quoted: substituted as text
  AND total_amount >= {{MIN_AMOUNT}}  -- unquoted: substituted as a number
Every placeholder needs a QA and a PROD value. Saving detects any that don't have them and prompts you first, so nothing reaches production unset.
Adding an environment
+ Env on the Variables tab. Uppercase letters, digits and underscores. The column appears immediately — no schema change required.
Orphaned variables
Remove a placeholder from your SQL and its row stays, flagged as an orphan. Deliberate: a typo shouldn't wipe values you spent time setting. The tab lists orphans with a one-click delete when you actually mean it.
Preview Mode
The Preview tab shows your SQL with placeholders replaced by the values for the currently selected environment. Flip the environment control next to Run and the preview follows, so you can check a PROD run before making one.
This helps you:
- Verify variable substitution is working correctly
- See the actual SQL that will be executed
- Debug variable-related issues
Executing Queries
Running Your SQL
- Write your SQL query in the Editor tab
- Configure any variables needed
- Click the Execute button
- Switch to the Results tab to see output
Viewing Results
The Results tab displays:
- Execution time in milliseconds
- Row count of results returned
- Data table with horizontal scrolling
- Error messages if the query failed
Error Handling
If your query fails, you'll see:
- The specific error message from the database
- Line numbers where applicable
- Suggestions for common fixes
Data Return Options
Configure how your data step behaves in pipelines:
Return Data to Pipeline
When enabled, your query results can be used by other pipeline steps:
- Format: Choose JSON, CSV, or XML output format
- Variable Name: Name to use when referencing this data in other steps
Example Usage
If you set the variable name to customer_data, other pipeline steps can reference it:
SELECT * FROM pipeline_data
WHERE customer_id IN ({{customer_data.customer_ids}})
Version Management
data-conductor automatically manages versions of your data steps.
Version Creation
A new version is created when:
- You save changes to a data step that's actively used in deployments
- The system detects the SQL has been modified
- You're updating a data step that has running pipelines
Version Comparison
Use the Diff tab to compare versions:
The diff view shows:
- Added lines in green
- Removed lines in red
- Modified lines highlighted
- Context lines for reference
Database Integrations
Supported Databases
data-conductor supports multiple database types:
- PostgreSQL (and compatibles)
- MySQL
- Microsoft SQL Server
- BigQuery (Google Cloud)
- Snowflake
- DataBricks
Testing Connections
Always test your database connections:
- Select your integration from the dropdown
- The editor will validate the connection
- Error messages appear if connection fails
Advanced Features
SQL Optimization Tips
Use LIMIT for Testing
SELECT * FROM large_table
WHERE condition = '{{VALUE}}'
LIMIT 10  -- Remove or increase for production
Index-Friendly Queries
-- Good: Uses index
WHERE created_date >= '{{START_DATE}}'

-- Avoid: Prevents index usage
WHERE DATE(created_date) >= '{{START_DATE}}'
Variable Placement
-- Good: Parameterized
WHERE status = '{{STATUS}}'

-- Avoid: SQL injection risk (though data-conductor sanitizes)
WHERE status = {{STATUS_RAW}}
Performance Monitoring
Monitor query performance:
- Execution Time: Shown in results
- Row Count: Indicates data volume
- Database Load: Check with your DBA for long-running queries
Common Patterns
Date Range Queries
SELECT *
FROM events
WHERE event_date >= '{{START_DATE}}'
    AND event_date < '{{END_DATE}}'
Incremental Processing
SELECT *
FROM transactions
WHERE last_modified > '{{LAST_PROCESSED_TIME}}'
ORDER BY last_modified
Conditional Logic
SELECT
    customer_id,
    CASE
        WHEN total_orders > {{VIP_THRESHOLD}} THEN 'VIP'
        WHEN total_orders > {{REGULAR_THRESHOLD}} THEN 'Regular'
        ELSE 'New'
    END as customer_tier
FROM customer_summary
Data Aggregation
SELECT
    region,
    DATE_TRUNC('{{PERIOD}}', order_date) as period,
    COUNT(*) as order_count,
    SUM(total_amount) as revenue
FROM orders
WHERE order_date >= '{{START_DATE}}'
GROUP BY region, DATE_TRUNC('{{PERIOD}}', order_date)
ORDER BY period DESC, revenue DESC
Troubleshooting
Common Issues
Variable Not Substituted - Check variable name matches exactly (case-sensitive) - Ensure variable is defined in the Variables panel - Verify test value is provided
Connection Timeout - Query may be too complex or slow - Check database server performance - Consider adding LIMIT clause for testing
Permission Denied - Verify database user has required permissions - Check table/schema access rights - Confirm integration credentials are correct
Syntax Errors - Use the Preview tab to see final SQL - Check for missing quotes around string variables - Verify database-specific SQL syntax
Getting Help
If you encounter issues:
- Check the Results tab for specific error messages
- Use Preview to verify variable substitution
- Test with simpler queries first
- Consult your database documentation
- Contact your administrator for permission issues
Next Steps
Now that you understand data steps:
- Create your first pipeline with multiple data steps
- Set up deployments to run your data steps automatically
- Learn about pipeline variables for advanced use cases
- Explore API integrations to connect external systems
Ready to deploy your data steps? Continue to Deployment Manager!