Your First Pipeline
This guide walks you through creating your first complete data pipeline in data-conductor, from building data steps to deploying automated workflows.
What You'll Build
By the end of this guide, you'll have:
- A SQL data step that processes your data
- Pipeline variables for dynamic queries
- A scheduled deployment that runs automatically
- Monitoring setup to track execution
Prerequisites
Before starting, ensure you have:
- [ ] Completed the Getting Started setup
- [ ] Database integration configured
- [ ] Organization settings properly configured
- [ ] Basic understanding of SQL
Step 1: Plan Your Pipeline
Define Your Data Flow
Before building, plan what your pipeline will do:
Example: Customer Sales Analysis
Input: Raw orders table
Process: Aggregate sales by customer and date
Output: Customer analytics summary
Schedule: Daily at 6 AM
Identify Variables
Plan what parts of your pipeline should be configurable:
Common Variables:
- Date ranges: {{START_DATE}}, {{END_DATE}}
- Filters: {{REGION}}, {{PRODUCT_TYPE}}
- Limits: {{ROW_LIMIT}}, {{BATCH_SIZE}}
- Environments: {{DATABASE_NAME}}
Step 2: Build Your Data Step
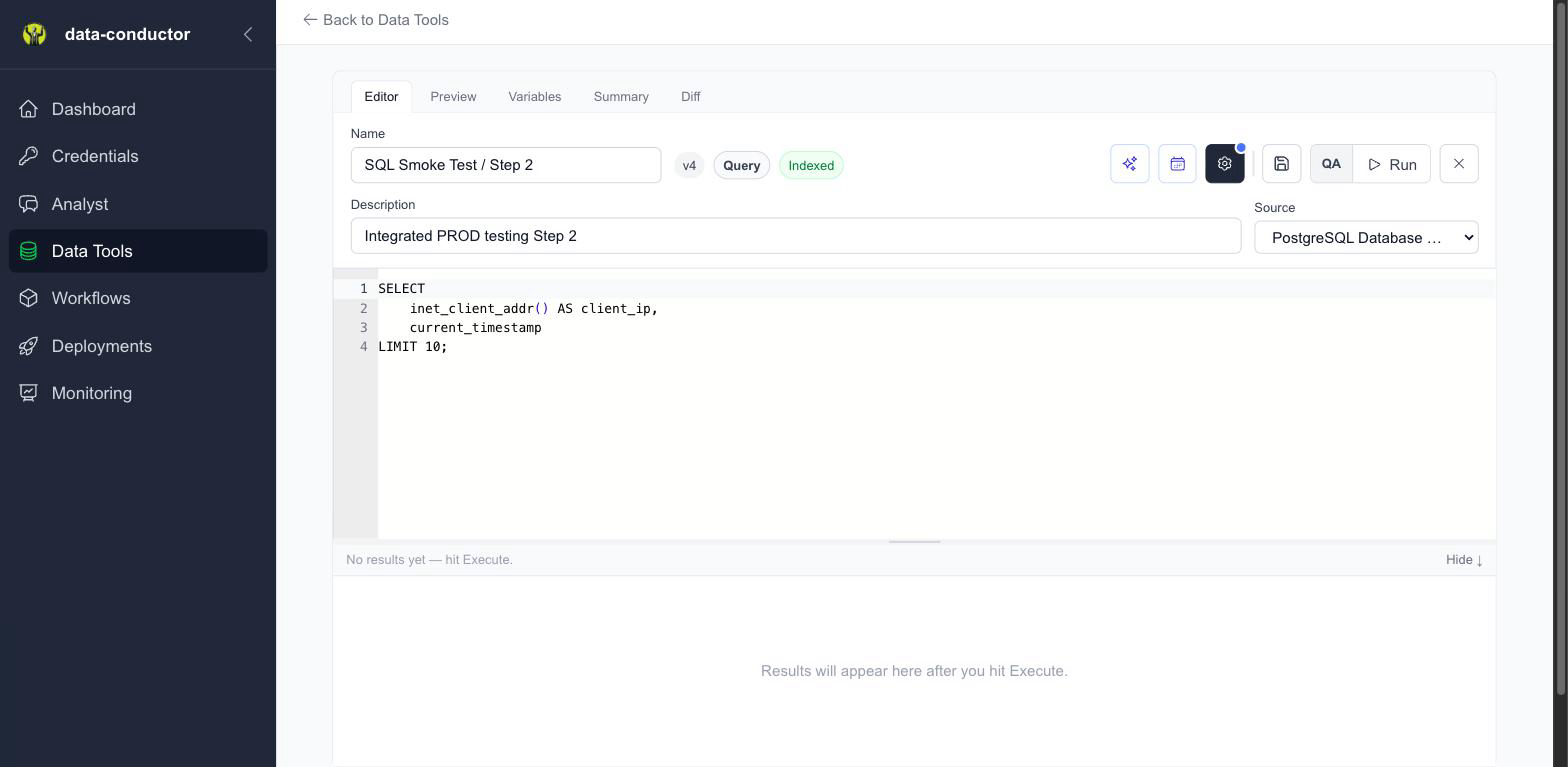
Create the SQL Data Step
- Navigate to Data Tools
- Click + New to create a new data step
- Fill in basic information:
- Name: "Customer Sales Analysis"
- Description: "Daily customer sales aggregation and analysis"
- Integration: Select your database
Write Your SQL Query
Start with a simple query, then add complexity:
Basic Version:
SELECT
    customer_id,
    customer_name,
    COUNT(*) as order_count,
    SUM(total_amount) as total_sales,
    AVG(total_amount) as avg_order_value
FROM orders
WHERE order_date >= '2024-01-01'
GROUP BY customer_id, customer_name
ORDER BY total_sales DESC
LIMIT 100
Enhanced with Variables:
SELECT
    customer_id,
    customer_name,
    region,
    COUNT(*) as order_count,
    SUM(total_amount) as total_sales,
    AVG(total_amount) as avg_order_value,
    MIN(order_date) as first_order,
    MAX(order_date) as last_order
FROM orders
WHERE order_date >= '{{START_DATE}}'
    AND order_date <= '{{END_DATE}}'
    AND (region = '{{REGION}}' OR '{{REGION}}' = 'ALL')
    AND total_amount >= {{MIN_ORDER_VALUE}}
GROUP BY customer_id, customer_name, region
HAVING COUNT(*) >= {{MIN_ORDER_COUNT}}
ORDER BY total_sales DESC
LIMIT {{ROW_LIMIT}}
Step 3: Configure Pipeline Variables
Add Variable Definitions
Open the Variables tab in the editor. Variables are an inline grid: one row
per {{placeholder}} in your SQL, one column per environment. QA and
PROD are always present; any custom environments you've added appear to
their right.
Cells save when you click away — there's no separate save action for the grid.
| Variable | QA | PROD |
|---|---|---|
START_DATE |
2024-06-01 |
2024-01-01 |
END_DATE |
2024-06-30 |
2024-12-31 |
REGION |
US-West |
ALL |
MIN_ORDER_VALUE |
50 |
0 |
ROW_LIMIT |
100 |
1000 |
The point of the two columns is that QA can run against a narrow slice while production runs the real range — same SQL, different values, no branching.
Every {{placeholder}} needs a QA and a PROD value. When you save a data
step, Data Conductor detects any placeholder without them and prompts you
before committing, so a variable can't silently reach production unset.
Adding an environment
Need more than QA and PROD? + Env on the Variables tab adds one — STAGING, DEV, whatever you call it. Names are uppercase letters, digits and underscores. The new column appears immediately.
Orphaned variables
Delete a placeholder from your SQL and its row stays in the grid, flagged as an orphan. That's deliberate — a typo shouldn't destroy values you spent time setting — but the Variables tab surfaces them with a one-click delete so refactors don't leave clutter behind.
Test Variable Substitution
- Switch to the Preview tab
- Confirm placeholders are replaced with real values
- Use the environment control to flip between QA and PROD and check both
Preview substitutes in the browser for instant feedback. The actual run substitutes server-side, so what executes is always resolved from the grid rather than from anything the page is holding.
Step 4: Test Your Query
Execute and Validate
- Click Execute to run your query
- Review results in the Results tab
- Verify data quality and structure
- Check execution time and performance
Validation Checklist: - [ ] Query executes without errors - [ ] Results contain expected columns - [ ] Data values are reasonable - [ ] Row count is within expected range - [ ] Execution time is acceptable
Optimize Performance
If your query is slow, consider:
Optimization Techniques:
-- Add indexes on filter columns
-- WHERE order_date >= '{{START_DATE}}' (needs index on order_date)
-- AND region = '{{REGION}}' (needs index on region)

-- Use LIMIT for testing
SELECT ... LIMIT {{ROW_LIMIT}}

-- Consider partitioning for large date ranges
WHERE order_date >= '{{START_DATE}}'
    AND order_date < DATE_ADD('{{END_DATE}}', INTERVAL 1 DAY)
Step 5: Configure Data Return
Set Up Data Output
If a later step needs to act on what this one returned, enable it here. Open Advanced ⚙ in the editor toolbar:
- Return data to pipeline: ✅ Enabled
- Format: JSON
- Variable name:
customer_analysis_data
Leave it off when nothing downstream reads the result. Stored results count toward your plan's transfer allowance, and there's a per-step size cap — so storing a full extract when you only need a row count is worth avoiding.
This toggle is also what makes conditional branching possible: a workflow edge testing a value from a previous step can only read data that was stored. See Workflows.
Usage in Downstream Steps:
-- Reference the data in other pipeline steps
SELECT customer_id, total_sales
FROM UNNEST({{customer_analysis_data}}) AS analysis
WHERE total_sales > 10000
Step 6: Save Your Data Step
Finalize and Save
- Review all configuration
- Test one more time with final settings
- Click Save to create the data step
- Note the data step ID and version
Step 7: Create a Deployment
Set Up Automated Execution
Now deploy your data step to run automatically:
- Navigate to Deployment Manager
- Click + New Deployment → Attach Pipeline to CRON
Configure Deployment Settings
Basic Configuration:
Name: Daily Customer Analysis
Description: Generate daily customer sales analytics for business intelligence
Workflow: Customer Sales Analysis (select your data step)
Version: v1 (latest)
Environment: PROD
Schedule Configuration:
CRON Expression: 0 6 * * *
Timezone: Your organization timezone
Description: Daily at 6:00 AM
Overlap handling:
When a run is still going and the next one is due:
  Skip it — don't run this time
A daily report is the case where skipping is right: if today's run somehow overruns into tomorrow, yesterday's numbers are no longer the ones you want. For a pipeline where every run is work that must happen — ingesting files, for instance — choose Queue it instead. See Overlapping runs.
Step 8: Monitor Your Pipeline
Set Up Monitoring
After deploying, monitor your pipeline:
- Deployments — is the schedule active, and when does it next run?
- Monitoring → Workflow Executions — did the pipeline run, and what triggered it?
- Monitoring → Runs — which step failed, and why?
Start at Executions and drop to Runs when you need step-level detail. The Dashboard's Steps w/ Errors card jumps straight to failures.
Key Metrics to Track: - Success Rate: Should be > 95% - Execution Time: Monitor for performance degradation - Data Quality: Review output for consistency - Error Patterns: Identify and address common failures
Step 9: Test and Validate
Manual Testing
Before relying on automated execution:
- Manual Execution: Use "Execute Pipeline" for immediate testing
- Variable Testing: Try different variable values
- Edge Cases: Test with empty results, null values, etc.
- Performance: Test with production data volumes
Validation Steps
Data Quality Checks:
-- Add validation queries to your pipeline
SELECT
    COUNT(*) as total_rows,
    COUNT(DISTINCT customer_id) as unique_customers,
    MIN(order_date) as earliest_date,
    MAX(order_date) as latest_date,
    SUM(CASE WHEN total_sales <= 0 THEN 1 ELSE 0 END) as invalid_sales
FROM customer_analysis_results
Step 10: Enhance and Iterate
Add Advanced Features
Once your basic pipeline works, enhance it:
Error Handling:
-- Add error handling and data validation
SELECT *,
    CASE
        WHEN total_sales < 0 THEN 'ERROR: Negative sales'
        WHEN order_count < 1 THEN 'ERROR: No orders'
        ELSE 'VALID'
    END as data_quality_status
FROM customer_analysis
Performance Optimization:
-- Add incremental processing
WHERE order_date > (
    SELECT COALESCE(MAX(last_processed_date), '1900-01-01')
    FROM processing_log
    WHERE pipeline_name = 'customer_analysis'
)
Data Enrichment:
-- Join with additional data sources
SELECT
    ca.*,
    geo.country,
    geo.timezone,
    seg.customer_segment
FROM customer_analysis ca
LEFT JOIN customer_geography geo ON ca.customer_id = geo.customer_id
LEFT JOIN customer_segments seg ON ca.customer_id = seg.customer_id
Troubleshooting Common Issues
SQL Errors
Variable Not Replaced:
Error: Column '{{START_DATE}}' doesn't exist
Solution: Check variable name spelling and configuration
Invalid Date Format:
Error: Invalid date '2024-1-1'
Solution: Use consistent format (YYYY-MM-DD)
Performance Issues
Query Timeout:
Error: Query execution timeout
Solutions:
- Add LIMIT clause for testing
- Optimize WHERE conditions
- Check database indexes
- Consider data partitioning
Long Execution Time:
Issue: Query takes > 5 minutes
Solutions:
- Review execution plan
- Add appropriate indexes
- Filter data more aggressively
- Consider pre-aggregated tables
Deployment Issues
CRON Not Running:
Issue: Scheduled deployment not executing
Solutions:
- Verify deployment is active
- Check CRON expression syntax
- Confirm timezone settings
- Review system logs
Best Practices Summary
Development Best Practices
- Start Simple: Begin with basic queries, add complexity gradually
- Test Thoroughly: Use small datasets first, then scale up
- Document Everything: Clear names, descriptions, and comments
- Version Control: Save major changes as new versions
- Error Handling: Anticipate and handle edge cases
Production Best Practices
- Monitor Actively: Set up alerts for failures
- Optimize Performance: Regular query performance reviews
- Data Quality: Implement validation checks
- Security: Use appropriate permissions and IP restrictions
- Backup Strategy: Regular data and configuration backups
Next Steps
Congratulations! You've built your first complete data pipeline. Here's what to explore next:
Immediate Next Steps
- Add more data steps to create complex workflows
- Set up API endpoints for external integrations
- Configure alerts for pipeline monitoring
Advanced Topics
- Pipeline Variables - Advanced variable techniques
- IP Security - Secure your deployments
- API Integrations - Connect external systems
Ready to build more complex pipelines? Explore the SQL Data Steps advanced features!